Executive Assessment Graphics Interpretation Questions
Graphics Interpretation question type
Graphics Interpretation (GI) questions present some form of graphic information. This graphic is accompanied by text, which gives more information, and is followed by fill-in-the-blank type statements. You have to "fill in the blank" by choosing the best option from a drop-down menu. The scoring in the Integrated Reasoning section of the EA does not allow for partial credit, so you will have to get both parts correct to receive credit for the question at hand.
In a GI question, you are expected to be able to interpret column charts, line graphs, pie charts, Venn diagrams, scatterplots, bubble graphs, flow charts, organization charts, and strategy maps. Unlike Table Analysis and Multi-Source Reasoning prompts, Graphic Interpretation prompts are static. You will not be able to change tabs or sort data, you will only use the information presented in the text and on the graphic itself.
Strategies and Concepts
As stated earlier, the Graphics Interpretation questions ask you about a chart, graph, diagram, or other visual form of information. It is vital that you learn how to interpret these, as well as how to incorporate the provided text with the information from the graphic. You'll note that there is often information presented in the text that is not provided in the graphic, but clarifies the data set provided. Pay attention to both images and words in this section, as you do not want to miss a piece of information that causes you to answer incorrectly.
Terminology
How to Read a Chart
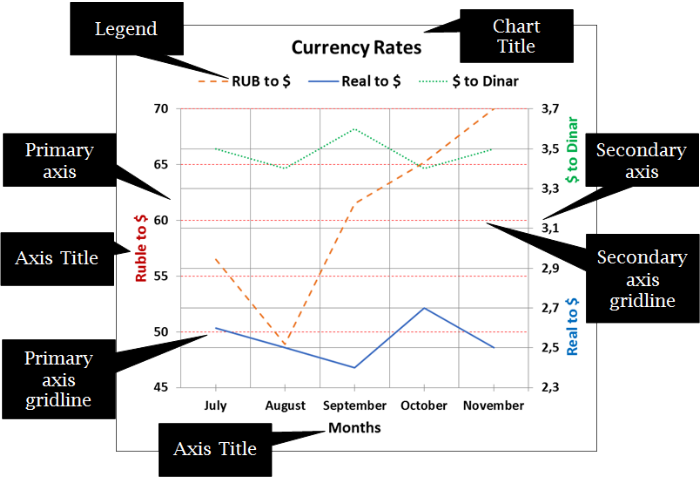
Once you understand the basic parts to a chart, you will want to focus on a few key parts to be sure you understand the information being conveyed. First, be sure to read the axes and the legend, if provided, so that you have an overview of the data and comparisons being made. Be sure you understand the scale being presented, for example, in the figure below, currency is being compared within a five-month period, not over a course of days, weeks, or years. Not taking the time to interpret these kinds of details often significicantly decreases your accuracy.
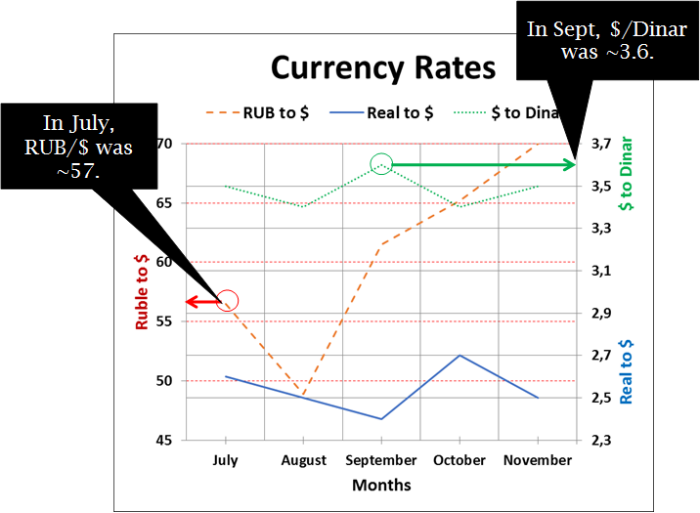
Also, remember you need not try to extract an EXACT value of data from a chart/graph. For example, in the figure below, the Ruble/$ rate was approximately 57 in July, and the $/Dinar rate was approximately 3.6 in September. Don't worry about the values being just approximations, the options will not be close enough that this will make a difference.
Be careful to choose the appropriate vertical scale while reading the values of Ruble/$ (on the primary vertical axis) and $/Dinar (on the secondary vertical axis).
Quantitative Concepts Tested in the Graphics Interpretation
The following concepts are tested in Graphics Interpretation questions:
- Absolute increase and decrease – determine the value difference between two numbers or quantities which are not expressed as a ratio or percentage.
- Percentage increase and decrease – determine the difference between two numbers and then divide by 100 to find the percentage. Positive results are an increase, negative results are a decrease.
- Determine Increased and Decreased Value – determine how the price of a commodity or investment changed over time to see if its value increased or decreased and by how much.
- Trend Lines – determine areas of resistance or support with a trend line which will connect two or more pieces of price point data.
- Correlation – determine a positive or negative correlation when the points on a scatterplot
Basic Probability – determine the likelihood that an event will happen in a set of defined conditions.
Process of Solving GI Questions
- Understand the data set
Read the question narration and the elements of the graph. Remember that it is often the case that the narration has critical information for fully understanding the graphic itself. Understand the relationship that each element has to the others. Sometimes legends are not given in the plot area; however, you can often obtain information from the question narration or notes provided outside the plot area. - Understand the question
As you know, there are two fill-in-the-blank questions in a GI dataset. You have to select the best option from a drop-down menu. Remember that there is no partial credit for correct responses. Both responses must be correct to get the credit for the question. Read the statement and stop to understand it. Mentally rephrase what is asked. - Develop an approach
There could be two ways to approach a question. Most GI questions ask for a value in a statement to be filled in. However, it is not necessary to actually calculate values every single time. Even a logical approach can work and save your time. After looking over the data set provided, read the questions so that you know what specific information you are being asked to interpret. Then decide whether you will need to make a calculation or not. - Apply the approach
Apply the approach you developed in the previous step. Before you look at the drop-down options, try to come up with your own answer. This way you can trouble-shoot immediately if your answer is not an option. Reassess the information provided in the graphic and reconsider your own understanding of the way the statement was phrased. Once you are ready, select the correct option. Jot down the results of the calculations, as it is likely that the results in previous question may be required for intermediary steps in the question that follows.
Example
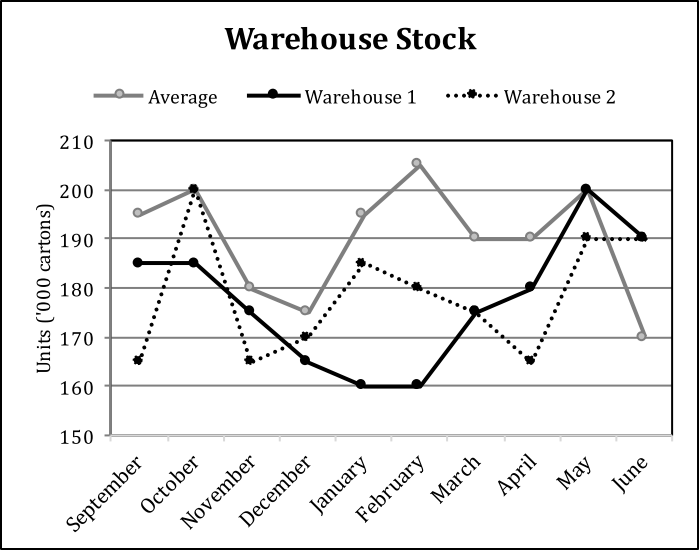
The PE Corporation has four warehouses that stock electric bulbs. The line-graph presents the number of cartons stocked by the first two warehouses, and an average stock of all the four warehouses for the months September to June.
Based on the given information, use the drop-down menus to most accurately complete the following statements:
(A) The highest number of electric bulb cartons stocked by the other two warehouses (warehouse 3 and 4) was in __________.
(A) October
(B) December
(C) February
(D) February and in May
(E) May
(B) The lowest number of electric bulb cartons stocked by the other two warehouses (warehouse 3 and 4) was in __________.
(A) November
(B) December
(C) December and in May
(D) May
(E) June
Solution — Part A
Let us understand the question. The PE Corporation has four warehouses. In the graph, the black line represents stocks for Warehouse 1, the dashed-line for Warehouse 2, and the grey line for the averages of all the four warehouses.
Note there is no information about warehouses 3 and 4 (WH 3 and WH 4). However, you still can find information about their stocks.
As you know,
Stocks for WH 3 + WH 4 = Total stocks of all the 4 warehouses - Sum of WH 1 and WH 2 stocks
=> Stocks for WH 3 + WH 4 = 4 x Average stock of all the 4 warehouses - Sum of WH 1 and WH 2 stocks
Look at the first part of the question:
The highest number of electric bulb cartons stocked by the other two warehouses (warehouse 3 and 4) was in __________.
Looking at the equation, you can deduce that
WH 3 and WH 4 stocks = 4 x average stock - WH 1 stock - WH 2 stock.
You can infer that to get the highest value for WH 3 and WH 4 stocks, the average stock value must be the highest, as it would increase their values, whereas the WH 1 and WH 2 stocks should be the lowest, as these otherwise would decrease their values to a minimum.
Instead of calculating the values for WH 3 and WH 4 stocks for all the given months in the options, you can analyze the options by observing the graph.
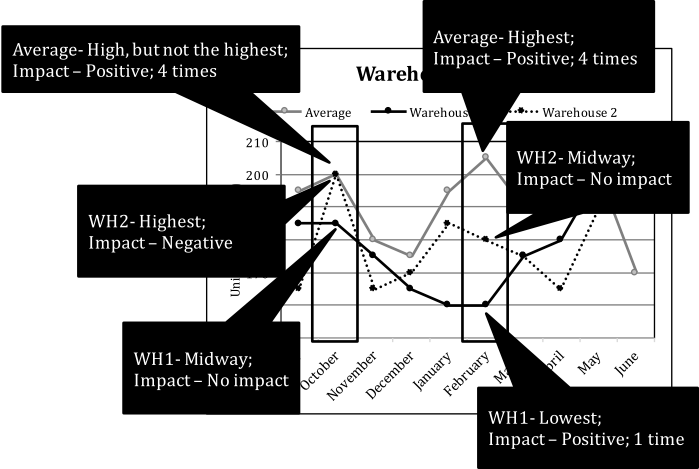
| Month | Value of Average Stock (Ideal - Highest) | Value of WH 1 stock (Ideal - Lowest) | Value of WH 2 stock (Ideal - Lowest) | Remarks |
|---|---|---|---|---|
| October | Too high (Positive for WH 3 and WH 4 to be highest) | High (Negative for WH 3 and WH 4 to be highest) | Highest (Most negative for WH 3 and WH 4 to be highest) | October cannot be the answer, as the two factors are negative. |
| December | Too low (Negative for WH 3 and WH 4 to be highest) | Too low (Positive for WH 3 and WH 4 to be highest) | Too low (Positive for WH 3 and WH 4 to be highest) | December can be eliminated as compared to February. It still has one negative factor. |
| February | Highest (Most positive for WH 3 and WH 4 to be highest) | Lowest (Most positive for WH 3 and WH 4 to be highest) | Mid-way (Neutral) | February is the correct answer. Out of three factors, two are the most positive, while the third one is neutral. |
| May | Too high (Positive for WH 3 and WH 4 to be highest) | Highest (Most negative for WH 3 and WH 4 to be highest) | Too high (Negative for WH 3 and WH 4 to be highest) | May cannot be the answer, as the two factors are negative. |
So, the correct answer is C.
If you are curious, here are the stocks for all months.
WH 3 and WH 4 stocks for Feb = 4 x 205 - 160 - 180 = 820 - 340 = 480.
Similarly, WH 3 and WH 4 stocks for October, December, and May months are: 415, 365, and 410, respectively.
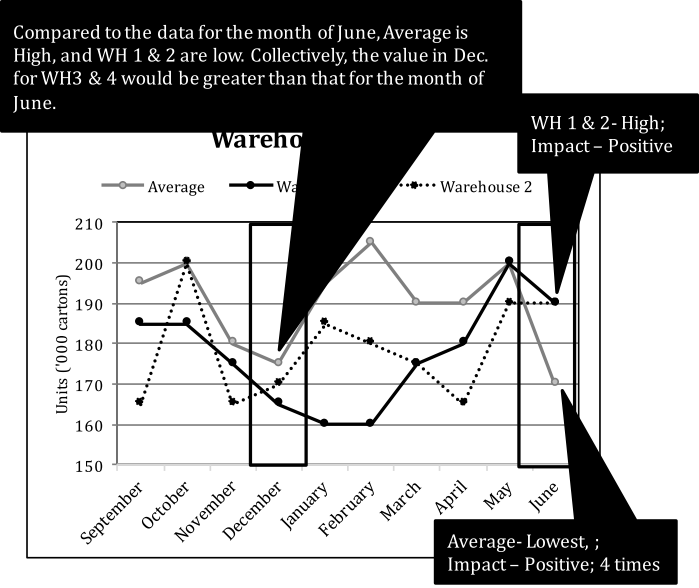
The following image can help you understand how to do the above analysis mentally.
Solution — Part B
Look at the first part of the question:
The lowest number of electric bulb cartons stocked by the other two warehouses (warehouse 3 and 4) was in __________.
This is a similar question to the previous one. You have to find the month that stocked the lowest number of cartons in WH 3 and WH 4, instead of the highest.
The strategy would be opposite of what you applied in the previous question.
Looking again at:
WH 3 and WH 4 stocks = 4 x average stock - WH 1 stock - WH 2 stock,
you can infer that to get the lowest values for WH 3 and WH 4, the average stock must be the lowest, as that would decrease the values, whereas WH 1 and WH 2 stocks should be the highest, as those, too, would decrease the values.
Inferring the probable values for the option months—November, December, May, and June— you can infer that June is the answer, as the average stocks for June is lowest of all the months, while the stocks for WH 1and WH 2 are high.
So, the correct answer is E.
If you are curious, here are the stocks for all months.
WH 3 and WH 4 stocks for June = 4 x 170 - 190 - 190 = 680 - 380 = 300.
Similarly, the values for November, December, and May are: 380, 365, and 410, respectively.
Take Away: Remember that if the average stock is the most positive for a month, its effect is four times that of each of WH 1 and WH 2 stocks.
Have a look at the following figure for more clarity.