SAT Prep – Math: Problem Solving & Data Analysis
DSAT Math Content: Problem Solving and Data Analysis Domain
This domain emphasizes quantitative reasoning using ratios, rates, percentages, and data interpretation. Questions frequently include tables, graphs, and real‑world scenarios.
Core Skills:
- Ratios, rates, and proportions
- Percent change
- Probability fundamentals
- Reading charts, tables, scatterplots
- Understanding mean, median, and trends
- Modeling real‑world scenarios mathematically
Example
The following Pie-chart shows the distribution of expenses of a company XYZ Ltd.
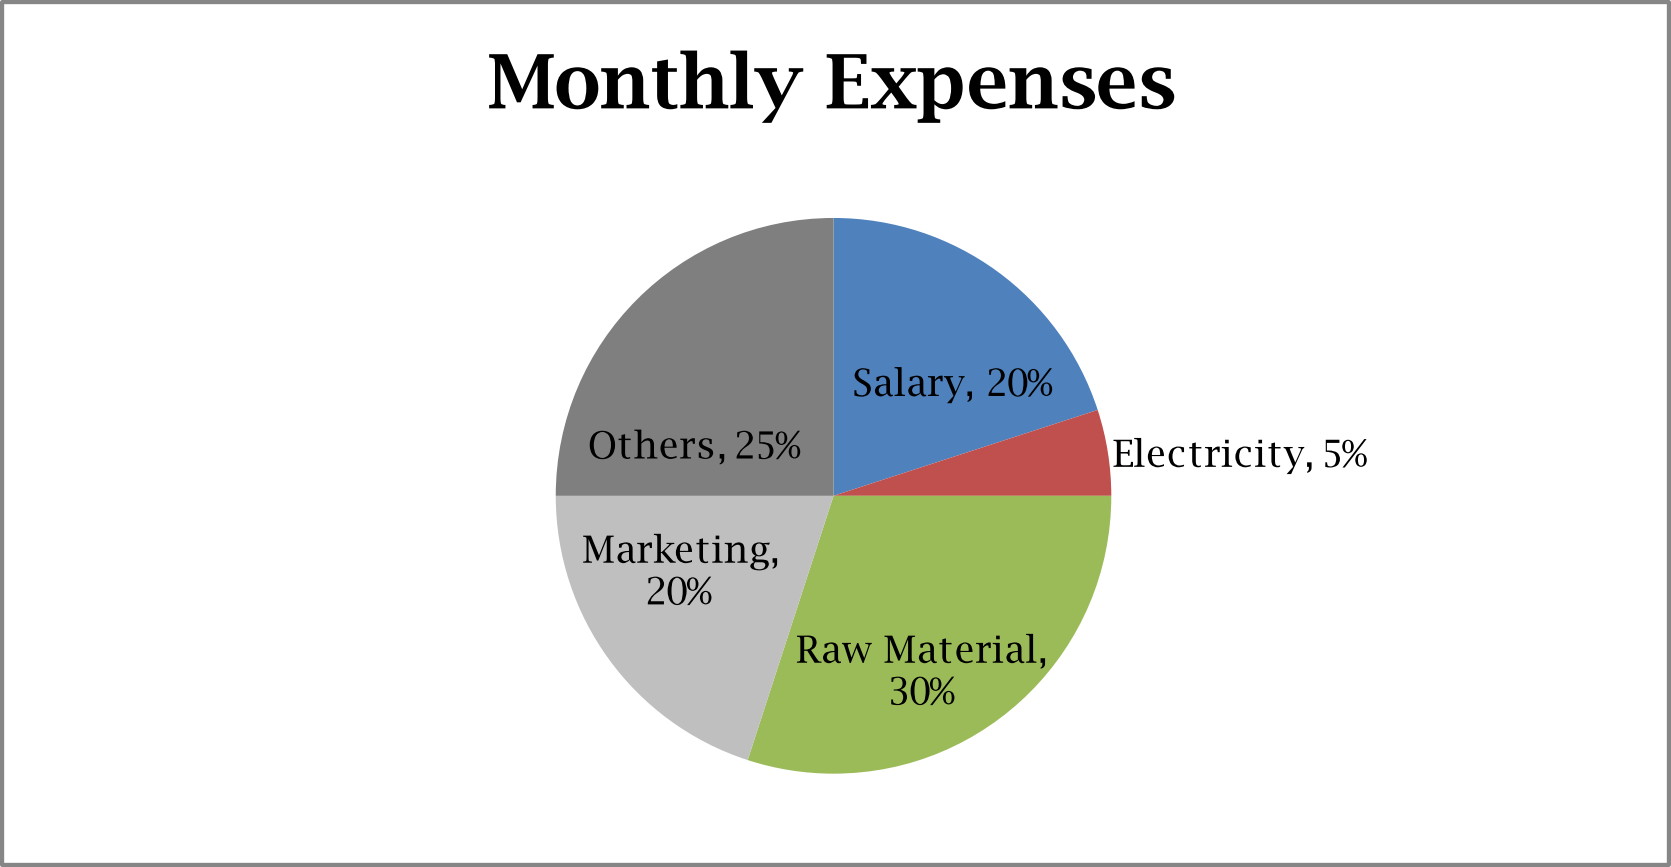
If the total expenses of the company are \$8,000, what is the difference between the expenses on Marketing and that on Raw material (in \$)?
Solution
Given: The total expenses of the company are $8,000
The expenses on Marketing = 20% of 8,000 $=\frac{20}{100}\times 8000=1600$
The expenses on Raw material = 30% of 8,000 $=\frac{30}{100}\times 8000=2400$
So, required difference $=2400-1600=\$800$
The correct answer is 800.
Applications:
- Social science data
- Scientific research summaries
- Financial literacy
- Everyday quantitative reasoning
Tools on SAT:
- Built‑in graphing calculator
- Flag questions to revisit later