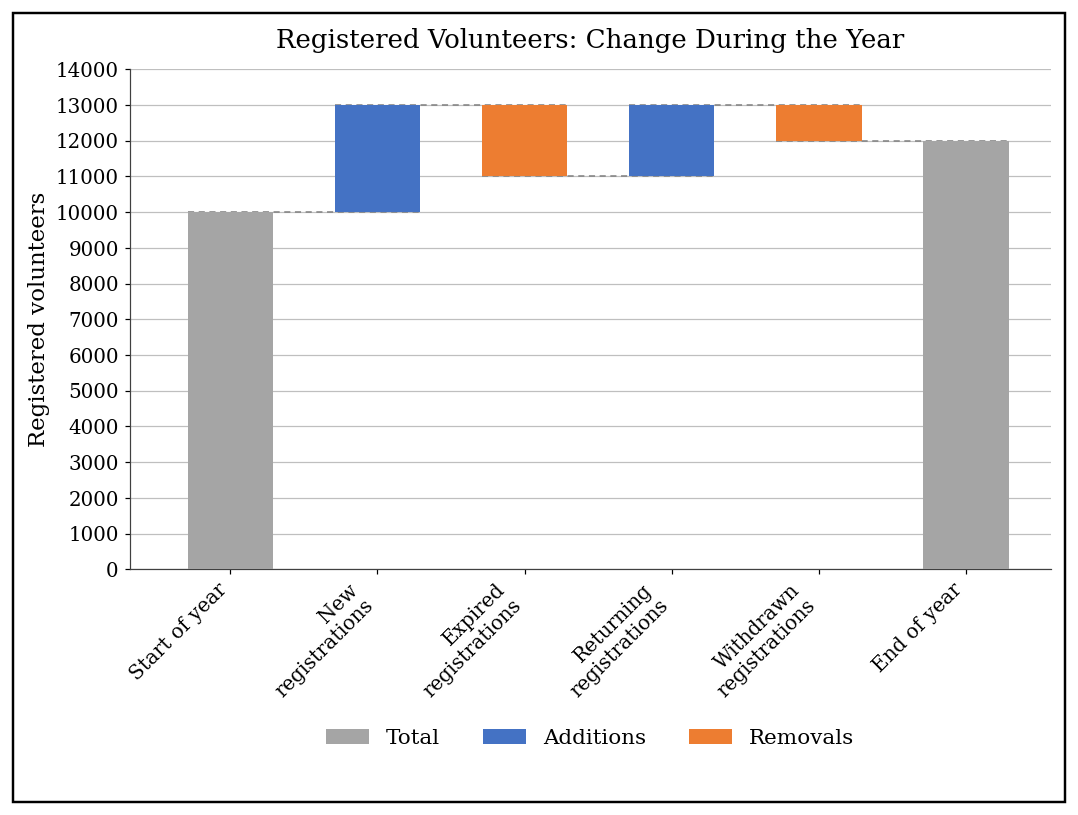
A certain volunteer network reports how its number of registered volunteers changed over one year. In the chart below the two grey bars give the totals at the start and at the end of the year. Each of the four floating bars gives one component of the change: a bar shaded as an addition raises the running total from its lower edge to its upper edge, and a bar shaded as a removal lowers the running total from its upper edge to its lower edge. The four components account for the whole of the change.
On the basis of this information, select from each drop-down menu the option that creates the most accurate statement.
Over the year the number of registered volunteers rose by percent.
The year's net change was, to the nearest whole percent, percent of the total of the four component changes, each component counted as a positive amount.