Ecologists tracked a herbivore, Species P, and its predator, Species Q, in a single grassland region for 30 years to study how the two populations changed together over time.
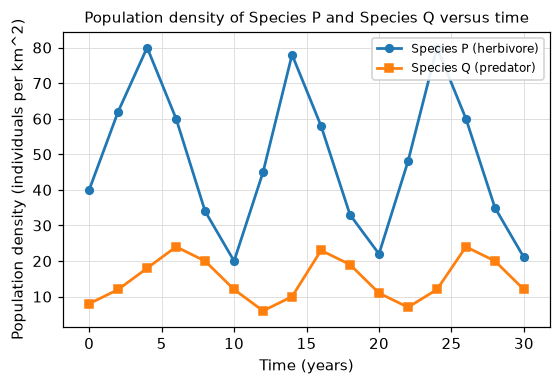
Each year, field teams counted the individuals of Species P (a herbivore) and Species Q (its predator) within a set of fixed survey plots spread across the region. Population density, reported as individuals per km^2, was found for each species by dividing its total count by the combined area of the plots. Figure 1 shows the estimated density of each species from Year 0 to Year 30, and Table 1 lists the densities at selected years. During the study, Species P was the main prey of Species Q, and no other predator of Species P was common in the region.
Table 1: Estimated population density (individuals per km^2) at selected years
| Year | Species P | Species Q |
|---|
| 4 | 80 | 18 |
| 6 | 60 | 24 |
| 10 | 20 | 12 |
| 12 | 45 | 6 |
| 14 | 78 | 10 |
| 16 | 58 | 23 |
| 24 | 80 | 12 |
| 26 | 60 | 24 |
Figure 1: Population density of Species P and Species Q versus time